What I did to learn R
Here’s how I got started learning R back in 2011. After this post, I’ll move on to something where we actually work with some data.
Stage 1
I installed R software on my computer.
I discovered the R-bloggers website and subscribed to the RSS feed. I’m still subscribed to the feed, and over the years I’ve been able to learn a lot by reading some of those posts. More about this at the end.
At first it was a struggle, as I was trying to type commands directly in R (in the terminal, or console) rather than typing the commands in a text editor. But I plugged away at it and was able to read in some data and make some calculations and make some charts and save those charts.
Stage 2
Then, some months after I’d first started with R and found it hard going, I decided to install RStudio. RStudio is an integrated development environment (IDE). What that means to me is I can have, all in one program and display,
- a text editor to type commands
- a terminal or console in which to execute those commands in R
- a file browser
- an environment pane which shows the objects (such as data, variables, functions, and so on) loaded in the current session
- a viewer for showing charts or maps and output of that sort
There’s even more, but those are some of the key things that I didn’t realize I would like to have all in one place, when I got started, but now I understand why it is so useful to be able to access all those functions in one place, using RStudio.
If you haven’t used an IDE before—I hadn’t—it can be a bit daunting. There are lots of panes and tabs in RStudio, with names like Jobs and History and Console and Packages and Projects. With a little time, one can soon be up and running with R in RStudio.
Stage 3
Then I went for a year or so typing scripts that would do some analysis, or make some chart, and then saving them. And with data too, I’d get some data and save it in a directory. I had a directory on my computer named R and it was filling up with all kinds of unrelated files.
Stage 4
Then I discovered Projects. I read this blog post—Designing projects—and realized that putting the data and the scripts together in their own directory (or folder) would be a much better way for me to organize things.
So I started doing that, for anything that I consider to be a project.
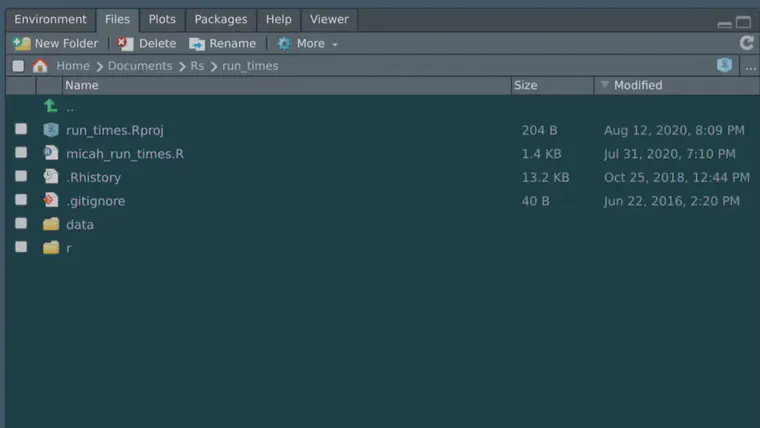
That’s a screenshot of the root directory of my run_times project as it appears in the RStudio Files pane. I’ve been keeping track of the time and distance of my runs, and I input and then analyze the data in that project. The micah_run_times.R file sources some files from the r directory to input new data and make a chart, and also reads and writes data from and to the files in the data directory.
Here’s the directory tree for that project, showing the files in the data and r directories.
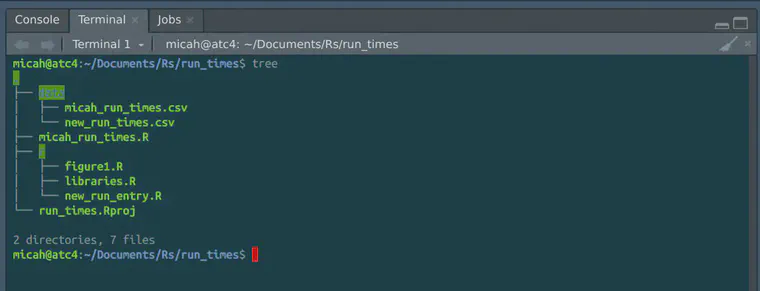
So that’s basically how I’ll try to keep things organized in a project now, with R scripts that will run code going into a directory I call r, and with data that I use for that project in the data directory.
Stage 5
And then there has been lots of practice, and plenty of searches for more information, based on the specific thing I was trying to accomplish at the time.
In the next post, I’ll try to get started with some real data, actually doing something with the software rather than writing about it.
As an example, here are some posts that I came across from R-bloggers or from direct subscription to the feed.
Make a trailer for your slidedeck with av by Maëlle Salmon
21 Recipes for Mining Twitter Data with rtweet by Bob Rudis
Project-oriented workflow by Jenny Bryan
Pretty much anything from ROpenSci
There are tons more, but you get the idea. One bit of the learning is me trying to learn to do something, like how can I write the code that will read in some data and then calculate the evapotranspiration, for example. A second part of the learning is how to keep somewhat organized while doing so. And a third part of the learning is not actively looking for new things, but having them show up in my RSS reader and then I can check out the new things that I can make use of, or that interest me.