rturf 9: libraries, plotting data, and decreasing green speed
 A first draft plot of clipping volume and green speed from the 2019 KPMG Women’s PGA Championship
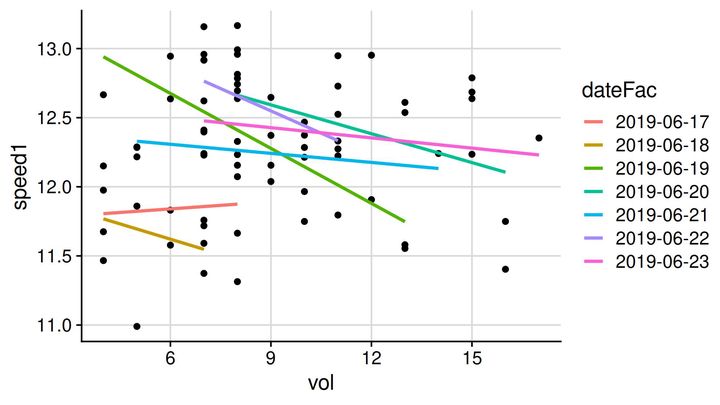
After all those previous posts in this series, we are finally ready to take a look at the clipping volume and green speed data together. In this screencast, I loaded some R packages, or libraries. Then I used functions within those packages to create a plot of the clipping volume of putting greens on the horizontal x-axis, with the corresponding stimpmeter measurement for that same green on the vertical y-axis.
These data were measured for seven consecutive days—for the three practice rounds and then the four tournament days. When looking at all the data together, it seems there is no relationship between clipping volume and green speed.
When looking at the relationship each day, however, there seems to be a negative slope of the linear regression line between clipping volume and green speed. This is without calculating any statistics or calculating any probabilities or making any models of how this might be. Some attempts to calculate that are coming up.